Arithmetic operations

Arithmetic operations
b_sum(first column number,last column number,results column number))
This adds the values across a row and stores the result in the 'results' column.
e.g. b_sum(1,3,4) will add the values in each row of columns 1 to 3 and store the result in the corresponding row of column 4.
c_sum(column number,label)
This adds the values in the designated column and stores the answer with the specified variable name.
e.g. c_sum(5,c) will add the values in column 5 and store the result with the program variable name, c.
diff(first column number,second column number,results column number)
This subtracts the values in the second column form those in the first and stores the results in the results column.
e.g. diff(6,3,7) will subtract the values in column 3 from those in column 6 and store the results in column 7.
inc(amount,column number,results column number)
This will add the amount to each item in the specified column and store the result in the results column.
e.g. inc(-1.25,1,2) will subtract 1.25 from each item in column 1 and store the results in column 2.
scale(amount,column number,results column number)
This will multiply each item in the specified column by the amount and store the results in the results column.
e.g. scale(0.87,3,5)) will multiply each item in column 3 by 0.87 and store the results in column 5.
b_min_max(first column number,second column number,minimum column number,maximum column number)
This finds the maximum and minimum values in the specified block of data and stored the results in the minimum and maximum columns.
e.g. b_min_max(1,4,5,6) will find the minimum and maximum values in each row of columns 1 to 4; storing the minima in column 5 and the maxima in column 6.
c_min_max(the column number,variable for minimum,variable for maximum)
This finds the maximum and minimum values in the designated column and stored the results in the specified variables.
e.g. c_min_max(3,pp[0],pp[1]) will find the minimum and maximum values in column 3 and store the results in the array values pp[0] and pp[1].
b_range(the first column number,the last column number,the results column)
This finds the range of values across each row of the designated block and stores the value in the results column.
e.g.
b_range(3,5,6) will find the range of values across a row from column 3 to column 5 and store the result in column 6.
c_range(the column number,the result variable)
This finds the range of values within the designated column and stores the result with the specified variable name.
e.g. c_range(4,b) will find the range of values in column 4 and store the result as b.
b_mean(the first column number,the last column number,the results column)
This finds the mean of the values across each row of the designated block and stores the value in the results column.
e.g. b_mean(1,4,5) will find the mean of the values across a row from column 1 to column 4 and store the result in column 5.
c_mean(the column number,the variable for the result)
This finds the mean of the values in the designated column and stores the result with the specified variable name.
e.g.
c_mean(7,d) will find the mean of the values in column 7 and store the answer as variable d.
parsum(the first column number,the second column number)
This finds the partial sums, (cumulative totals), of the data in the first column and stores the results in the second column.
e.g.
parsum(4,6) will find the partial sums of the data in column 4 and store them in column 6.
sigma(the first column number,the second column number,label)
This finds the sum of the products of the values in the specified columns and stores the result with the designated variable name.
e.g. sigma(1,5,d) will multiply each element in column 1 by the corresponding item in column 5 and store the total of the products with the label d.
replace(lower limit,upper limit,replacement,the column number,the results column number)
This checks the data in the first column and, if the value, v, is such that lower limit ≤ v ≤ upper limit, v is replaced by the replacement value in the results column. Otherwise, the original value is transferred to the results column.
e.g. replace(1.1,2.3,0,1,2) will transfer the data from column 1 to column2, replacing the value by zero if 1.1 ≤ value ≤ 2.3
s_d(the column number,label for the result)
This finds the Standard Deviation of the data in the designated column and stored the value with the specified variable name.
e.g. s_d(5,x) will find the Standard Deviation of the data in column 5 and store it as variable x.
N.B. This will produce a result for any set of data but will only have validity if the data is normally distributed.
dist(type,interval,the column number,the results column number,label for the initial value, (the minimum))
e.g. dist(c_d_f,10,4,5,d) will find the cumulative distribution of the data in column 4 over 10 steps and store the results in column 5 with the minimum value being stored as variable d.
This was developed as part of the 'histogram' command but may have some use in its own right.
The 'type' parameter takes the same values as in 'histogram'. The command will find the distribution of the data in the designated column and stores the results in the results column with the initial, (minimum), value stored with the specified label.
sort(the number of fields,the order,the first column number,the last column number,the first results column number,the key column numbers)
The command allows a block of data to be sorted on any number of key columns which can be used in any order.
e.g. sort(3,ascend,1,4,5,1,2,4) will sort the data in the block of columns 1 to 4 in ascending order using as the 3 key fields column 1, then column 2 and finally column 4. The sorted data is stored in a block starting at column 5.
The 'order' parameter takes the values ascend or descend.
If the sorted data is to replace the original set, then the results column number is made the same as the intial.
e.g. sort(3,ascend,1,4,1,1,2,4) for the example shown above.
regress(type,the X-data column number,the Y-data column number)
A form is displayed which allows the entry of X-values and displays the corresponding Y-value on the basis of regression onto the designated line.
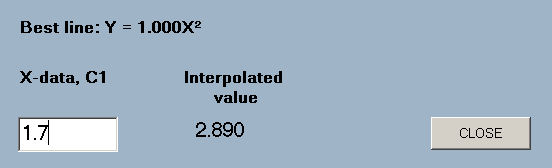
e.g. regress(quad,1,2) will find the quadratic of best fit to the data in columns 1 and 2 and display a form for the entry of X-values.
The 'type' parameter takes the same values as in 'best_line'.
round(type,number of figures,the source column number,the results column number)
The items in the source column are rounded according to the specification and stored in the results column.
The 'type' parameter takes the values 'dp' or 'sf'.
| Type | |
| Values | Result |
| dp | Rounding to decimal places |
| sf | rounding to significant figures |
e.g. round(sf,3,1,2) will round the data in column 1 to 3 significant figures; storing the results in column 2.