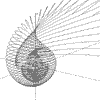
|
r = (a + b)/(a*a + b*b)
a = 0 to 2pi, b = 0 to 2pi
|
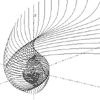
|
r = 1/(a + b)
a = 0 to 2pi, b = 0 to 2pi
|
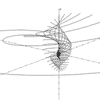
|
r = (a + b)/a*b
a = 0 to 2pi, b = 0 to 2pi
|

|
r = a + b
a = 0 to 2pi, b = 0 to 2pi
|
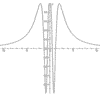
|
y = Sin(8/(x^2 + 1))
x = -5pi to 5 pi
|
|
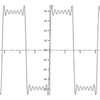
y = Sin(x)+Sin(3*x)/3+Sin(5*x)/5+Sin(7*x)/7
+Sin(9*x)/9+Sin(11*x)/11+Sin(13*x)/13
Square wave synthesis
x = -3pi to 3pi
|
|
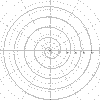
r = a^2
Archimedes spiral
a = 0 to 10pi
|
|
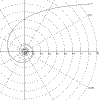
r = 1/a
Hyperbolic spiral
a = 0 to 2pi
|
|
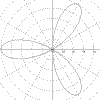
r = 4*Cos(a)*(Sin(a)^2) - Cos(a)
Trifolium
a = -2pi to 2pi
|
|
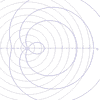
r = 2*Cos(a) + n, (n = 1, 2 & 3)
Limaçon of Pascal
a = 0 to 2pi
|
|
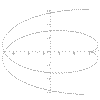
x = Cos(t) + t*Sin(t)
y = Sin(t) + t*Cos(t)
t = -2pi to 2pi
|
|
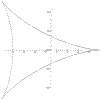
x = 2*Cos(t) + Cos(2*t)
y = 2*Sin(t) + Sin(2*t)
Deltoid
t = 0 to 2pi
|
|
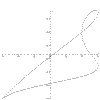
x = (t + 1)/(t^3 + 1)
y = (t + 1)/(t^2 + 1)
t = -100 to 100
|
|
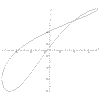
x = (t^2 - 1)/(t^4 + 1)
y = (t^2 - 1)/(t^3 + 1)
t = -100 to 100
|